Find the products, regions, channels, or other business locations behind a margin movement. FactorPrism ranks the drivers, keeps gains and declines visible, and reconciles the bridge to the reported change.
Margin movement hides in the interaction of many segments — some profitable, some loss-making, some flipping between quarters. The question isn't just which segments moved; it's where the compression lives: a broad-based cost force, or three specific product lines underwater.
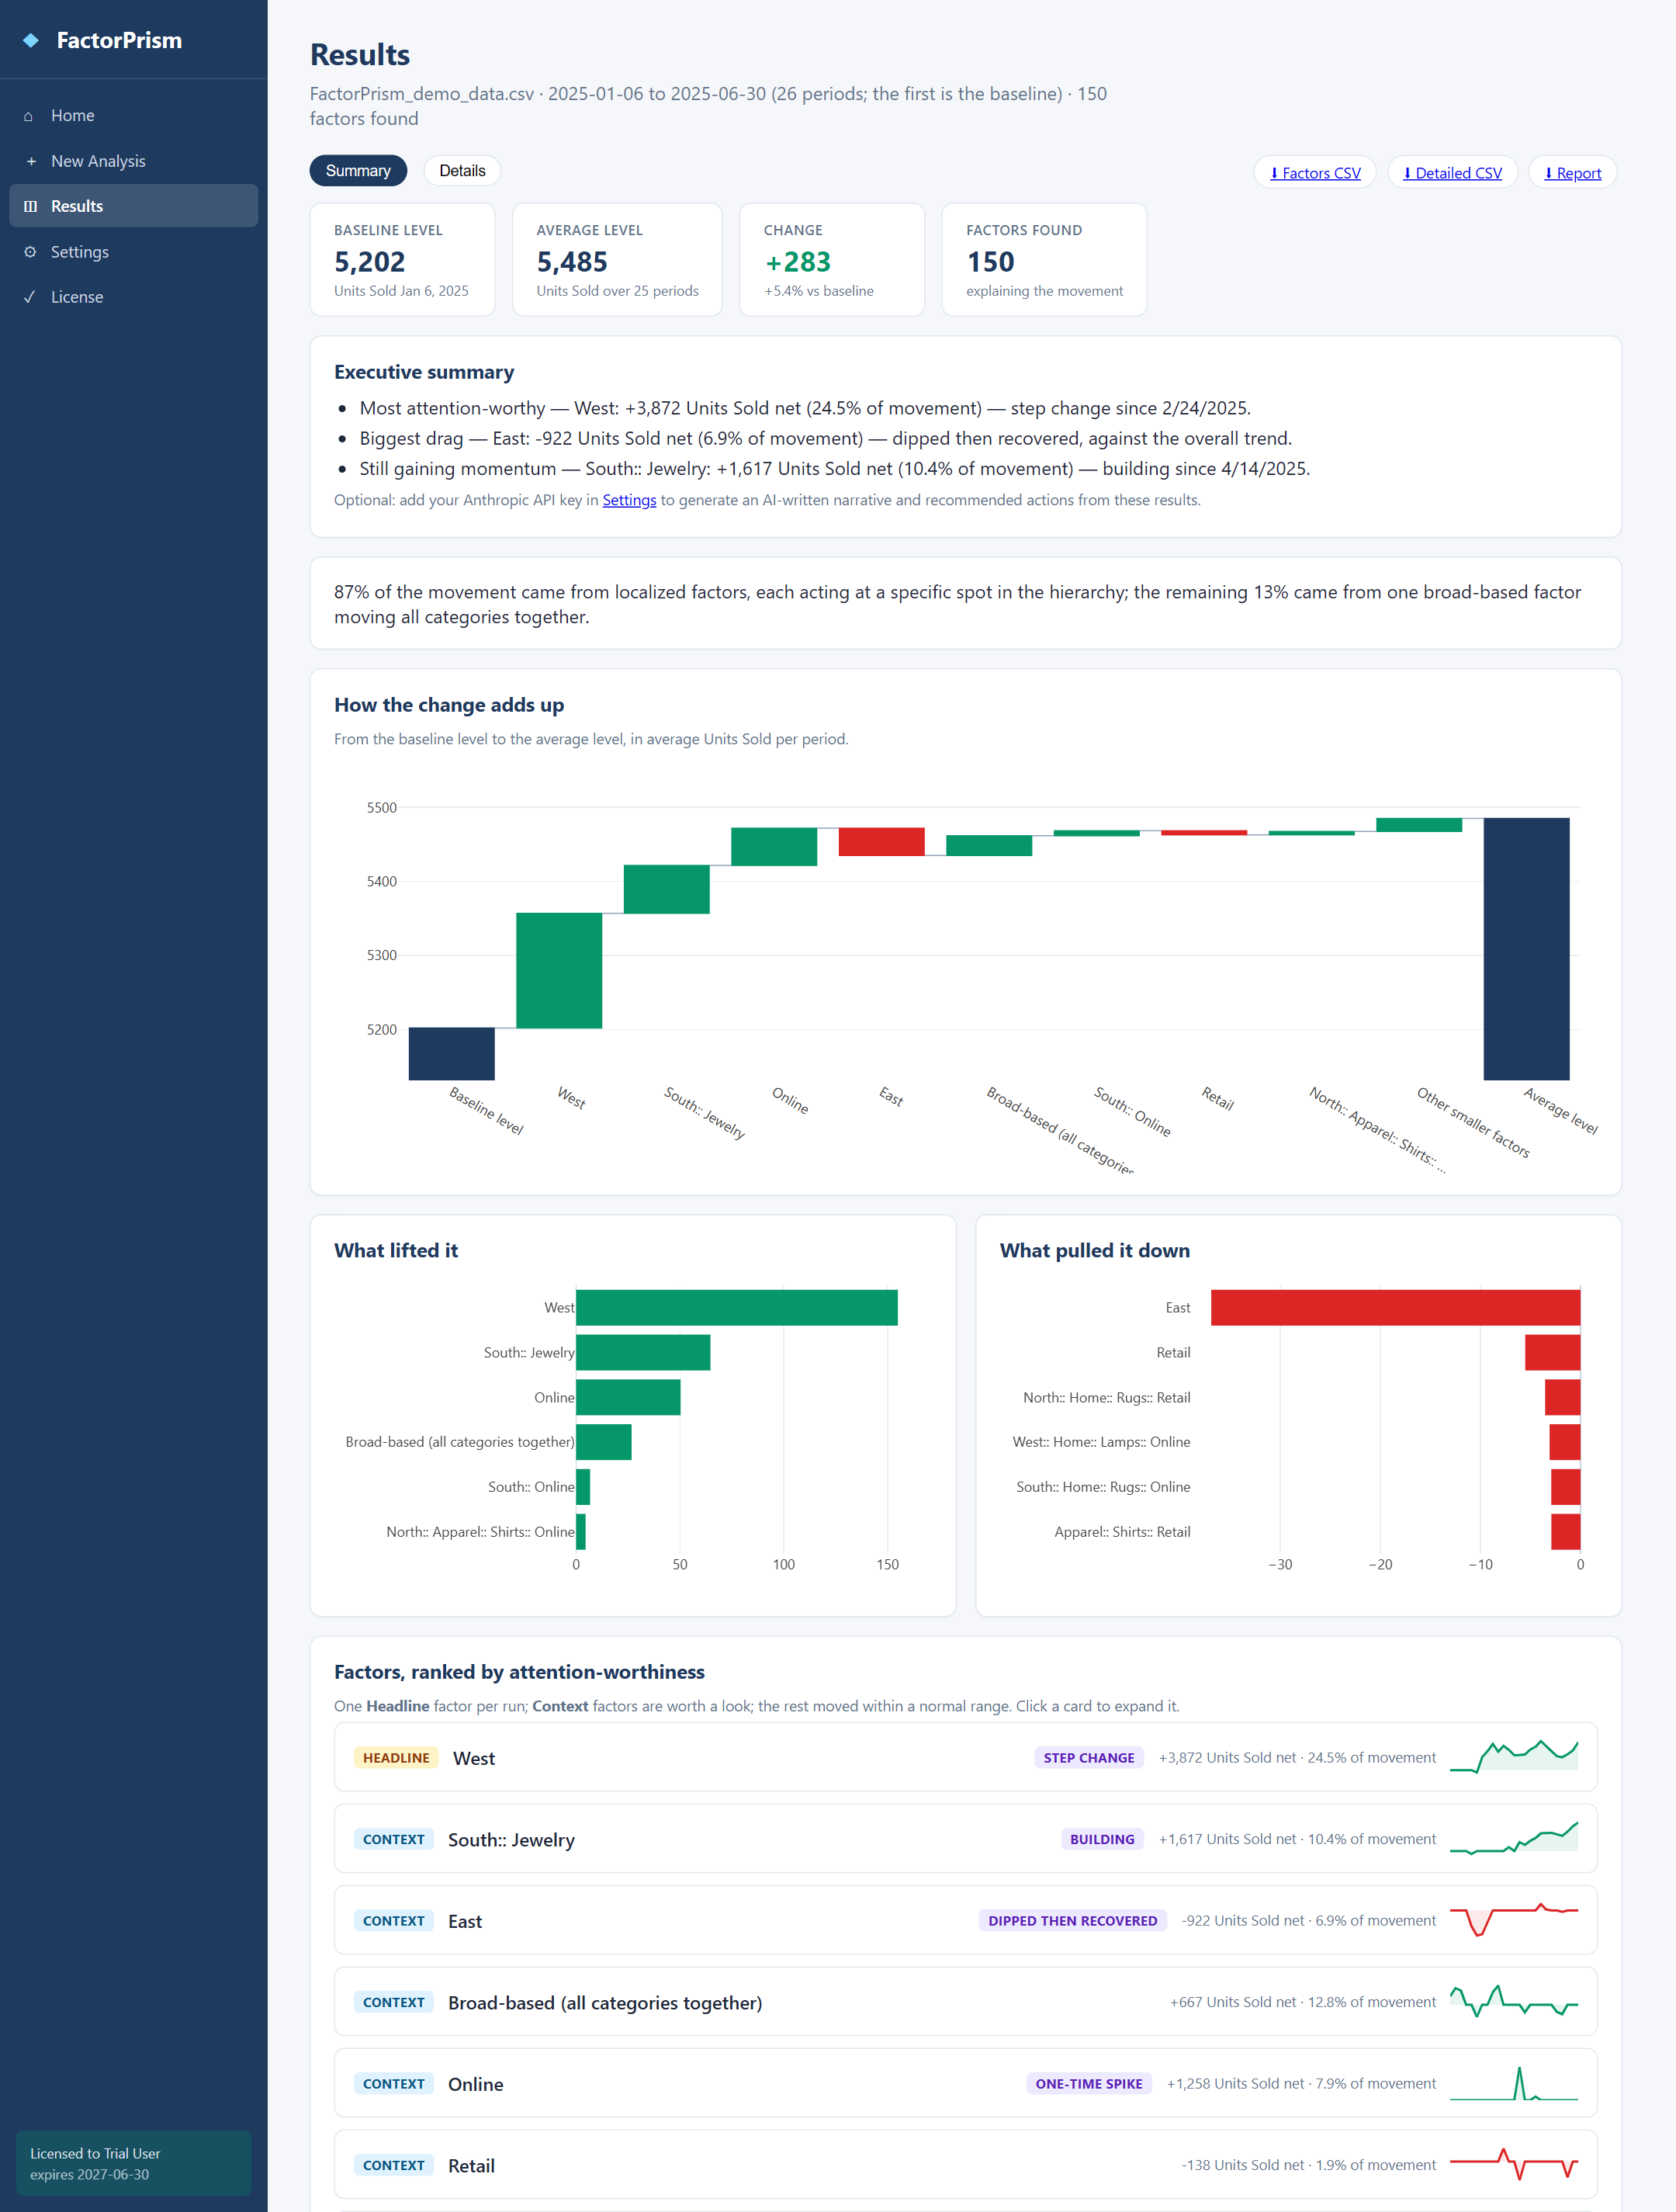
The useful output is not every segment that moved. It is the business locations that best explain the movement, their direction and contribution, and whether gains and declines offset.
FactorPrism®'s engine handles negative values and sign-crossing series natively:
Related: Budget vs actual · Revenue bridge · Churn & net-adds movement · vs Snowflake's built-in functions
Bring a gross-margin question to a focused guided evaluation, or install FactorPrism and create a Finding for it.
Request a guided evaluation Get it on Snowflake Marketplace