Use your plan or budget column as the baseline. FactorPrism ranks the products, regions, channels, and other business locations behind the variance, keeps offsetting beats and misses visible, and reconciles the bridge to the reported total.
A 1% total variance can be exactly that — or it can be a 20% collapse in one region's product line masked by an unplanned beat somewhere else. The roll-up cancels the story out. The variance bridge auditors and CFOs actually want doesn't just say which line items missed; it locates the causes — across region × product × channel at once — and proves they sum to the total.
Planning suites compare plan to actual line by line and template a narrative around the biggest deltas. Three things go missing:
Point FactorPrism at a table or view with actuals and a plan or budget column, then select the quarter, month, or other window to analyze. Its proprietary AI-powered analysis finds and ranks the business locations behind the variance.
Start with questions such as “What drove the quarterly revenue miss?”, “Which region offset the product shortfall?”, or “Where did operating expense exceed plan?”
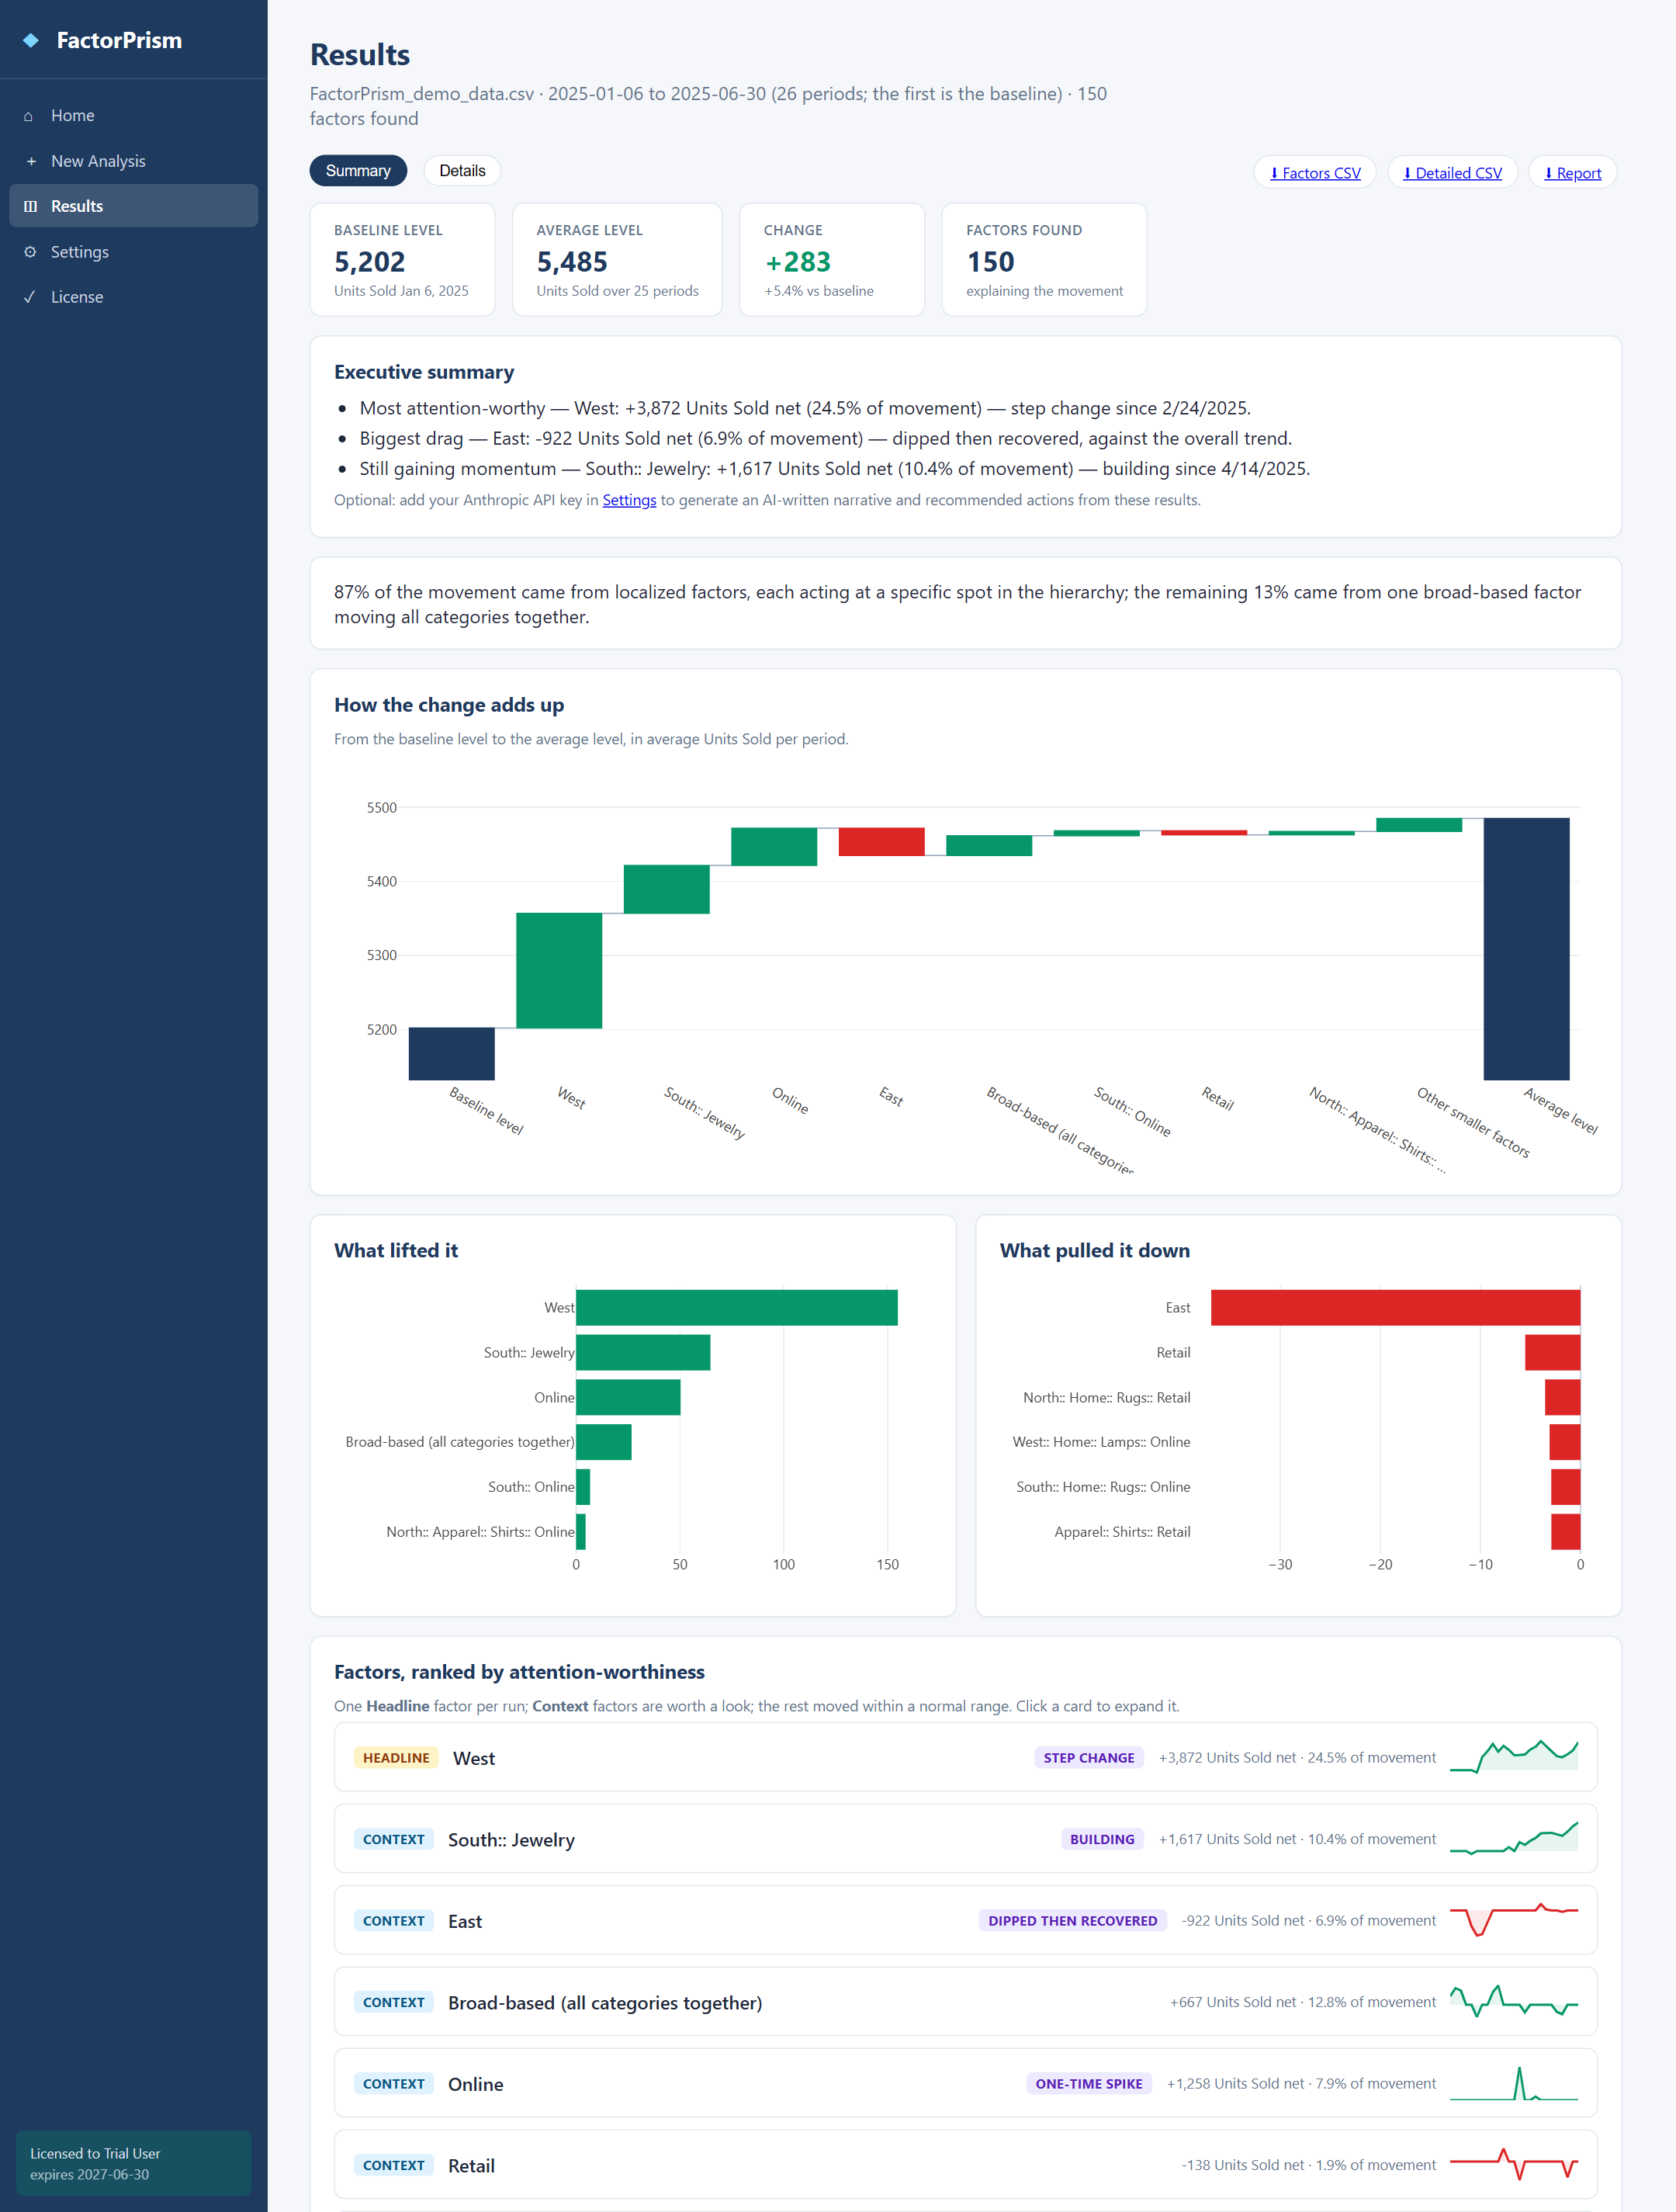
A date column, your business dimensions (region, product, channel…), the actuals column, and a plan/budget column alongside it. Grant read-only access, pick the plan column in Setup, choose the window to explain, and run. If your plan lives in a separate table, a one-line view joining the two is all it takes.
Related: Revenue bridge · Gross margin bridge · FactorPrism for Cortex Code · FactorPrism for Snowflake
Bring a plan-versus-actual question to a focused guided evaluation, or install FactorPrism and create a Finding for it.
Request a guided evaluation Get it on Snowflake Marketplace