Know what changed, where it changed, and how much each factor contributed.
FactorPrism® analyzes a governed Snowflake table or view, ranks the factors behind the change, and reconciles their contributions to the reported result. Use the app for investigation or the API for automation.
The app organizes each result as a Finding with factor evidence, an Investigation Plan, history, and monitoring. The API returns structured results to SQL, tasks, pipelines, and agents.
Not on Snowflake? Download the FactorPrism® app for Windows, Mac, or Linux — same analysis engine, runs entirely on your computer.
FactorPrism® finds the factors behind a KPI change, locates where each one acted, and quantifies how much each contributed. It also surfaces factors that only appear at the intersection of dimensions.
The app organizes every result as a Finding: the answer, factor evidence, Investigation Plan, history, and monitoring stay attached to the business question. The API returns the same structured factor results to automated workflows.
Use FactorPrism where the question lives: in a Finding for people, or in a programmable workflow for software.
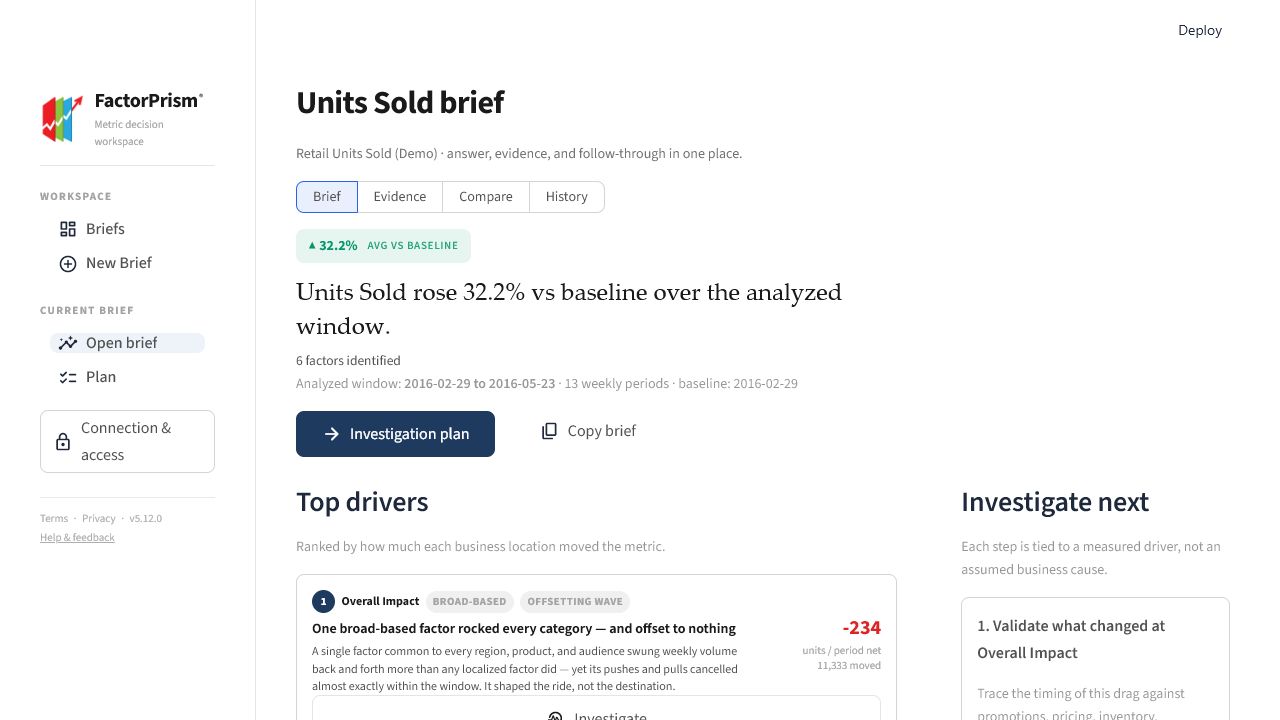
Open a business question and see which factors drove the result. Follow each factor to its evidence, build an Investigation Plan, compare history, and monitor the metric over time.
Call the same analytics engine from SQL, Snowflake tasks, data pipelines, or approved agents. Return structured results without turning an automated workflow into a screen-driven process.
All the power of advanced root-cause attribution with the security and governance your enterprise demands.
Stop guessing. Automatically identify the specific business locations behind changes in your metrics.
Analysis runs entirely in your Snowflake warehouse. Your data never leaves your environment, with full governance controls.
See exactly how much each factor contributed with intuitive visualizations and AI-powered insights.
From a business question to a Finding your team can investigate and revisit.
Grant FactorPrism® read-only access to one table or view. Your data stays in Snowflake under your existing governance.
Select the metric, time grain, business dimensions, and comparison window that make the recurring question meaningful.
See the ranked factors and their contributions, inspect the evidence, work the Investigation Plan, compare history, or put the question on watch.
Every factor sums to the total change—no plug
Across 280 blind benchmark runs, in its operating regime
Pinpoints the segment and intersection, not just the headline
In our NYC case study
When we analyzed NYC's public 311 service data, the headline looked simple: 11% growth in complaints. But FactorPrism® automatically attributed this across category and time to surface the real story:
FactorPrism® surfaced these patterns automatically from the public 311 dataset—no manual segment-by-segment hypothesis testing required.
See How We Did ItOne number (11% growth) became dozens of actionable insights:
"Complaints are up 11%"
"Overall growth masks a 25% drop in housing issues, seasonal water system stress, and infrastructure failures in specific years"
Revenue grew 12%. Traditional analysis allocated it all at the regional level. FactorPrism® found the right hierarchy: half was a company-wide lift, while Northeast was hiding a -3% drag behind that baseline.
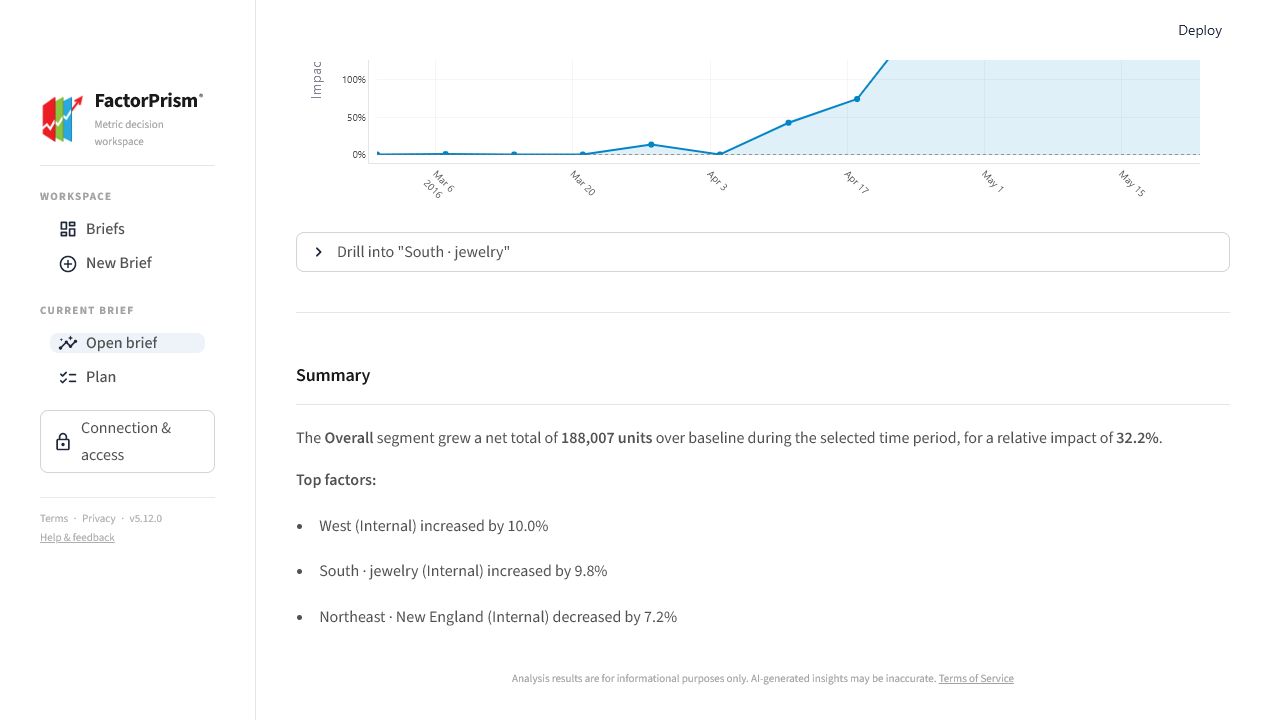
Read case studyTraditional BI showed "Jewelry +22%" and "South +24%" as separate dimensions. FactorPrism® found the right level: the South + Jewelry intersection contributed 9% of the 18% growth—the decisive factor was one specific combination.
Read case studyFirst-pass denial rate jumped 8% to 12%. By payer, by code, and by service line, three dashboards told three different stories. FactorPrism® found that one Payer × CO-197 × Orthopedics intersection drove half the spike—built for payers and RCM vendors.
Read case studyHand-built bridges double-count, smear broad-based forces across every region, and only "tie" because of a plug. FactorPrism® builds the bridge automatically — every factor located where it acts, summing exactly to the change.
See the recipeMargin data crosses zero — segments flip from profit to loss, and standard attribution math quietly falls apart. FactorPrism® handles sign-crossing data natively, separating gains from declines so offsetting stories stay visible.
See the recipeNet flows hide offsetting stories: strong acquisition in one region can mask a churn problem in another for months. FactorPrism® locates each component — which segments, which direction, starting when — reconciled exactly.
See the recipeA miss to plan is rarely uniform—a beat in one place can hide a collapse in another. FactorPrism® locates each piece of the variance across region, product, and channel, and the bridge ties out to the total gap exactly.
See the recipeAlready testing Snowflake's built-ins? They flag where a metric changed. FactorPrism® goes further—the right level including intersections, gains and declines separated, and a breakdown that ties out to the total—all as a native app, your data never leaving the account.
See the comparisonHow FactorPrism's reconciled-to-the-total, intersection-level attribution stacks up against the tools you already run in your warehouse, and the thinking behind it.
Turn a changed metric into a complete Finding with measured factors, evidence, and next investigations. FactorPrism® runs natively in Snowflake—your data stays secure while you see where the movement originated. Prefer to work outside Snowflake? Download the FactorPrism® app and run the same analysis locally on Windows, Mac, or Linux.
Free during early access · 30-day Marketplace trial · No card required · Guided evaluation available before installation.
Install FactorPrism® from the Snowflake Marketplace, grant read-only access to the table or view that holds the metric, and create a Finding for the business question. FactorPrism ranks the factors behind the change, shows where each acted, and reconciles their contributions to the total change.
No. FactorPrism® is a Snowflake Native App: the analysis runs entirely inside your Snowflake account, and the app only needs read-only SELECT access to the tables or views you choose. Nothing is extracted to any outside service.
FactorPrism® is free during early access, with no card required. Post-GA (target Q4 2026), pricing follows Snowflake's consumption model: you pay only for the warehouse compute you use, billed through your existing Snowflake account, with no seat fees and no annual contracts. See pricing for details.
Yes. Watch the 70-second product demo or request a guided evaluation before connecting your own table or view.
Yes. The app organizes each analysis as a Finding for people. The API exposes the same analytics engine to SQL, Snowflake tasks, alerting pipelines, and AI agents such as Snowflake Cortex Code, returning structured results that software can query and save.
TOP_INSIGHTS is a SQL function that returns a flat list of segments whose metric changed; the segments can overlap, and they are not organized into a hierarchy or reconciled to the total change. FactorPrism® computes a complete answer—each factor located at the level where it acts, gains and declines separated, everything summing exactly to the change—and presents it in a full interface with an AI-written explanation. See the detailed comparison.